

















Record Turnover Masks Massive Distribution: SNDK Post-Earnings Volume Profile
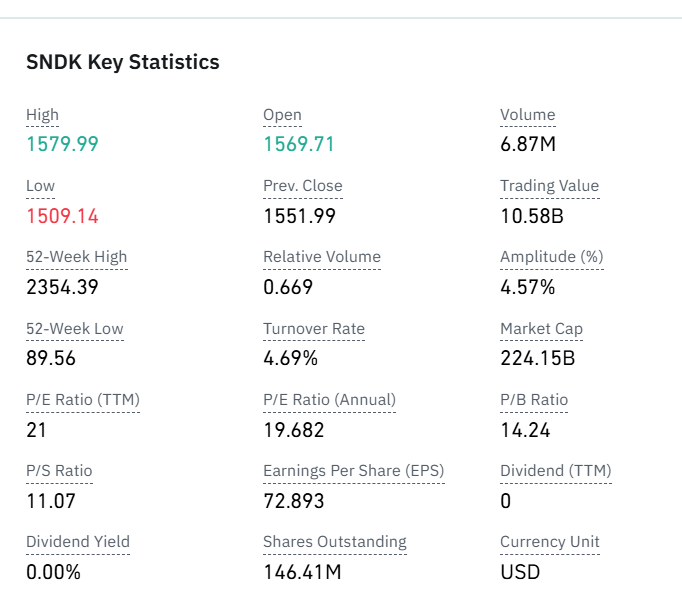
SNDK displayed extreme market liquidity in recent trading, generating a vertical turnover of $10.586 billion across 6.8738 million shares, representing a turnover rate of 4.69%. For a semiconductor hardware giant commanding a $224.152 billion market capitalization, liquidity velocity of this scale signals maximum tension between aggressive sellers and passive buyers. Rather than producing a bullish expansion, price action absorbed heavy supply across a volatile 4.57% intraday range before closing in negative territory. Heavy turnover accompanied by negative price closes points to high-volume distribution from early accumulators taking strategic exit liquidity.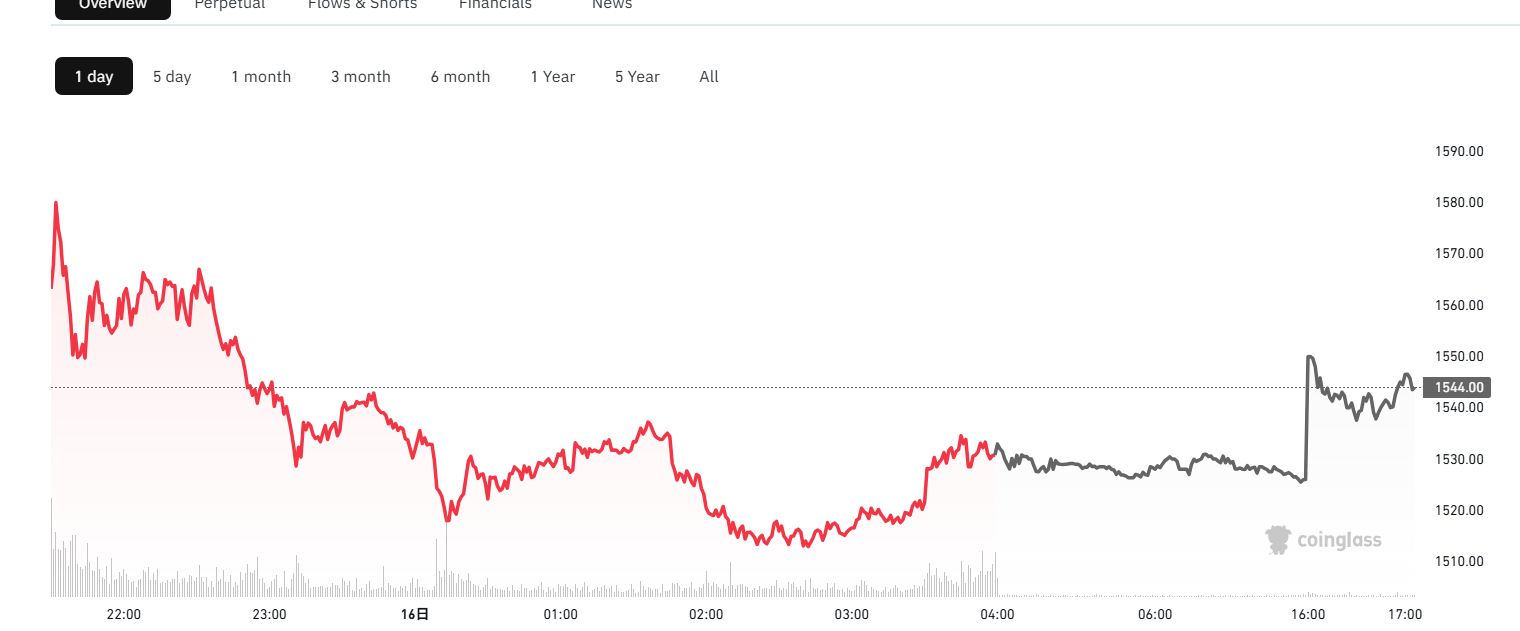
Institutional Capital Flight: Auditing the $1.226 Billion Net Outflow
Underneath the surface of massive gross volume lies severe structural weakness. Total daily capital inflows registered $4.263 billion against $5.489 billion in total outflows, leaving an acute net institutional deficit of $1.226 billion. Order size analysis confirms that institutional participants drove the distribution. Large institutional orders generated $1.105 billion in gross outflows versus only $674 million in inflows, marking a net outflow of $431 million. Medium-sized institutional orders compounded the damage with an additional $644 million in net outflows. The synchronized dumping across large and medium tiers proves well-capitalized market participants used peak daily liquidity to systematically offload inventory.
The Derivatives Mirage: Spot Selling Masked by False Contract Premiums
A deceptive technical divergence appeared between spot books and perpetual contracts. While the regular cash session closed at $1530.89, perpetual swap contracts traded at $1543.76, maintaining an unnatural positive basis of nearly $13. Premarket activity mirrored this divergence around $1540.77. This marginal premium creates an artificial impression of after-hours accumulation and resilient bullish sentiment. In contrast to continuous spot block selling, this narrow perpetual premium reflects small-scale algorithmic positioning designed to attract retail long entries into the regular session open, creating exit liquidity for institutional cash-market blocks.
Persistent Short Accumulation: 6 Million Shares Pinning Downward Pressure
Daily Short Volume Stiffens Overhead Supply
Short-side participants continue to demonstrate aggressive positioning across all major clearing venues. Following peak single-session short volume exceeding 5 million shares in mid-August, daily short turnover has maintained elevated runs between 2 million and 3 million shares. Bearish desks have not reduced short exposure during consolidation phases; instead, short positions systematically increase whenever price action tests bands above $1570. This unrelenting short volume forms an overhead liquidity cap, compressing bullish recovery attempts into an increasingly narrow intraday corridor.Macro Short Interest Benchmarks Above 6 Million Shares
From a structural cycle perspective, aggregate short interest remains anchored firmly above the pivotal 6 million share threshold. While below the historical high of 9 million shares, this baseline represents the second-highest platform of the past two years. Significant short capital remains locked into this zone. The failure of bulls to force short covering alongside consistent spot outflows indicates that short-side institutions maintain high conviction regarding extended multiple compression, waiting for a breakdown below crucial baseline defense levels to trigger forced selling.